Pixels vs. Numbers: PDF Charts Your RAG Can Query
June 27, 2026
Every PDF pipeline eventually meets the same wall: the chart. A quarterly revenue bar graph is trivial for a human - four bars, four labels, four numbers - but for most document parsers it is a dead end. The parser sees a rectangle of pixels, crops it out, drops it into a folder, and moves on. Your RAG system is left holding a .jpg. It cannot answer "what was Q1 2026 revenue?" because that number was never turned into text - it stayed locked inside the image.
I ran the same investor presentation through two of the best open-source document parsers available today - MinerU (OpenDataLab) and Docling (IBM, with the Granite Vision chart-extraction model) - to see exactly where they diverge. The headline result is not subtle. Faced with an identical "Revenue ($M)" bar chart, one tool gave me a picture, and the other gave me a table I can query.
This article walks through why, step by step.
The test: one chart, two parsers
The source is a single slide from SMR-1Q26-Presentation.pdf - a navy-blue bar chart titled Revenue ($M) with four bars:
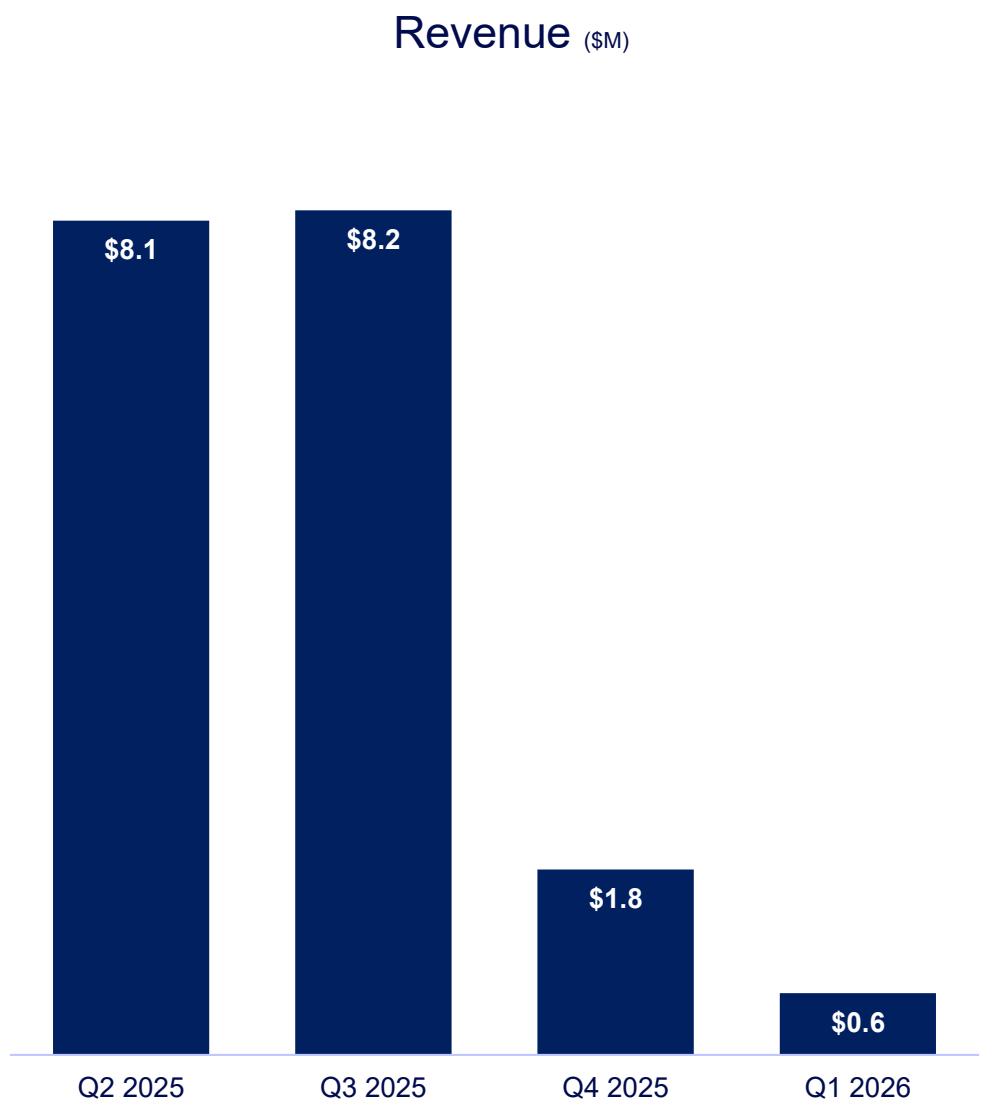
- Q2 2025 → $8.1
- Q3 2025 → $8.2
- Q4 2025 → $1.8
- Q1 2026 → $0.6
What MinerU produced
MinerU correctly located the chart and even classified it. Here is the exact record from its _content_list.json:
{
  "type": "chart",
  "img_path": "images/58bd777e...db196463.jpg",
  "content": "",
  "chart_caption": [],
  "chart_footnote": [],
  "bbox": [572, 148, 944, 885],
  "page_idx": 9
}
Look closely at two fields. "type": "chart" - MinerU knows it is a chart. And "content": "" - but it extracted nothing from it. The output Markdown reflects this:
Liquidity & Capital Resources ($M)

The chart is now a 42 KB JPEG. The numbers $8.1, $8.2, $1.8, $0.6 exist only as colored pixels inside that image. To a downstream LLM, this region is opaque.
See it in the published repo: the cropped chart JPEG, MinerU's full Markdown output, and the _content_list.json record.
What Docling + Granite Vision produced
From the identical slide, Docling emitted this directly into the Markdown - no image, no OCR guesswork:
Bar chart

| Quarter   |   Value |
|-----------|---------|
| Q2 2025   |     8.1 |
| Q3 2025   |     8.2 |
| Q4 2025   |     1.8 |
| Q1 2026   |     0.6 |
Straight from the published Docling output — this Revenue table lives at lines 248–255, and the same values are also written out as a machine-readable charts CSV.
Every value matches the slide exactly. The chart is now structured data. A RAG system can read line 255 - | Q1 2026 | 0.6 | - and answer the revenue question without ever touching an image model.
Same PDF. Same chart. One produced a photograph; the other produced a spreadsheet.
Step by step: why the outputs differ
The difference is not accuracy or model size - it is pipeline design. Each tool makes a deliberate decision about what to do when it meets a figure.
Step 1 - Layout detection (both tools do this)
Both parsers start by segmenting the page into regions: text blocks, titles, tables, and figures. On this run MinerU used its PP-DocLayoutV2 layout detector, with paddleocr_torch for text, unimernet_hf_small_2503 for formulas, and SlanetPlus/UnetStructure for tables; Docling ran its docling-layout-heron layout model with TableFormer for tables. At this stage, both tools agree: "there is a figure here, at this bounding box." So far, identical.
Step 2 - Figure classification (the fork in the road)
Here the paths split.
-
MinerU tags the region with a
type- and in newer versions it even distinguisheschartfrom a plainimage. But classification is where its visual understanding ends. There is no downstream model whose job is to read the chart's data. So the region is cropped, saved as a JPEG, andcontentis left empty. -
Docling, when you enable
do_chart_extraction, automatically enables picture classification as a gate. Each detected picture is classified - bar chart, pie chart, line chart, or "not a chart." A positive classification doesn't end the process; it triggers the next stage.
This is the crucial architectural insight: for MinerU, "chart" is a label. For Docling, "chart" is a routing decision that sends the image to a specialist model.
Step 3 - Chart-to-data reconstruction (only Docling has this)
When Docling classifies a picture as a chart, it hands the cropped image to a dedicated IBM Granite Vision model. On the machine used for this test, Docling's default chart-extraction kind is GRANITE_VISION_V4, which loads ibm-granite/granite-vision-4.1-4b - a 4-billion-parameter vision-language model - and drives it with a <chart2csv> task token. (Docling also ships the lighter granite-vision-3.3-2b-chart2csv-preview, which is steered with the natural-language prompt "Convert the information in this chart into a data table in CSV format.")
Either way, the model was trained on code-generated synthetic charts, so it has learned to map bar heights, axis ticks, data labels, and category names back into rows and columns. It outputs structured CSV - not a caption, not a description, but the actual numbers. The supported chart types are bar_chart, pie_chart, and line_chart.
MinerU has no equivalent stage. Its VLM and OCR models are tuned to read text and formulas, not to reverse-engineer a plot's data. There is simply no chart2csv step in its graph, so a chart can never become a table.
Step 4 - Serialization into the document
Docling takes the model's tabular output and threads it back into the document object as a real table. In code, the extracted data lives on the picture item itself:
for item, _level in doc.iterate_items():
    if isinstance(item, PictureItem) and item.meta and item.meta.tabular_chart:
        chart_type = item.meta.classification.get_main_prediction().class_name
        table = item.meta.tabular_chart.chart_data
        grid = [[""] * table.num_cols for _ in range(table.num_rows)]
        for cell in table.table_cells:
            grid[cell.start_row_offset_idx][cell.start_col_offset_idx] = cell.text
        # grid is now [["Q2 2025","8.1"], ["Q3 2025","8.2"], ...]
That grid is what becomes the Markdown table - and, if you want, a CSV or an Excel sheet. MinerU's serializer, by contrast, has only an empty content string and an image path to write, so it emits an  link.
Putting it in a table
| Stage | MinerU | Docling + Granite Vision |
|---|---|---|
| Locate the figure | ✅ Yes | ✅ Yes |
| Classify as "chart" | ✅ Yes (type: chart) | ✅ Yes (as a routing gate) |
| Read chart data | ❌ None (content: "") | ✅ granite-vision-4.1-4b (<chart2csv>) |
| Output for this chart | A .jpg image crop | A Markdown/CSV data table |
| RAG can query the values | ❌ No (pixels) | ✅ Yes (text) |
Why this matters for RAG
A retrieval pipeline can only retrieve what was turned into text. When MinerU emits a chart as an image, the four most important numbers on that slide vanish from the searchable corpus. Your vector index never embeds "$0.6M Q1 2026 revenue," because that string was never produced. The user asks the question, the retriever finds the surrounding prose, and the model either says "I don't know" or - worse - hallucinates a figure.
Docling closes that gap. By reconstructing the chart into | Q1 2026 | 0.6 |, it makes the visual data a first-class, embeddable, retrievable citizen of the document. The chart stops being "dark matter" and becomes part of the knowledge base.
The honest caveats
This is not a claim that Docling is universally better - it's a claim that it does something MinerU structurally does not. A few things to keep in mind:
- Chart-to-data is probabilistic. Granite Vision reconstructs values from pixels; on unconventional or cluttered charts it can misread a bar or invent a row. Always treat extracted chart tables as high-quality estimates, not audited figures.
- It costs compute. The
chart2csvstage is an extra 4-billion-parameter VLM pass per chart - meaningfully slower, and it really wants a GPU. - MinerU is excellent at what it targets. For dense text, formulas (→ LaTeX), and tables (→ HTML) across 109 languages, MinerU is fast and strong. If your documents are text- and equation-heavy rather than chart-heavy, the missing
chart2csvstep may not matter to you at all.
Conclusion
The same PDF, the same bar chart, two philosophies. MinerU treats a chart as an object to preserve - it finds it, labels it, and faithfully saves the picture. Docling, armed with Granite Vision, treats a chart as data to recover - it finds it, routes it to a specialist model, and reconstructs the numbers behind the bars.
For document archival, MinerU's image-faithful output is perfectly reasonable. But for any pipeline whose whole purpose is to make a document answerable - RAG, financial analysis, research aggregation - the difference between 58bd777e....jpg and | Q1 2026 | 0.6 | is the difference between a parser that sees your charts and one that actually reads them.
Appendix: exactly what ran on this machine
For reproducibility, here is the precise stack behind the two outputs above. Both ran locally on an NVIDIA GeForce RTX 5070 (Blackwell, sm_120) with PyTorch 2.12.1+cu130 (CUDA 13.0), on the same source file SMR-1Q26-Presentation.pdf.
Docling (chart → table):
docling2.107.0,docling-core2.85.0,docling-ibm-models3.13.3,transformers5.8.1- Layout:
docling-project/docling-layout-heron - Tables:
docling-project/docling-models(TableFormer) - Figure/chart gate:
docling-project/DocumentFigureClassifier-v2.5 - Chart-to-CSV:
ibm-granite/granite-vision-4.1-4b(default kindGRANITE_VISION_V4,<chart2csv>task token) - Pipeline flags:
do_chart_extraction=True(which auto-enables picture classification)
MinerU (chart → image):
- MinerU 3.4.0,
hybridbackend, effortmedium, OCR disabled (_ocr_enable: false) - from the run's_middle.json - VLM:
opendatalab/MinerU2.5-Pro-2605-1.2B - Pipeline models (
opendatalab/PDF-Extract-Kit-1.0, ONNX): layoutPP-DocLayoutV2, formulaunimernet_hf_small_2503, OCRpaddleocr_torch, table classifypaddle_table_cls, table structureSlanetPlus/UnetStructure - The chart region was recorded in
_content_list.jsonas"type": "chart"with"content": ""and animg_pathto the cropped.jpg.